Courtesty Pixabay | rawpixel
GUEST POST BY WISEGUYS MARKETING’S BRUCE GREGOIRE
In Part 1 of our series, we addressed The Art and Science of Customer Lifetime Value (LTV) – and why, although LTV is a valuable metric, it is commonly overlooked by marketers.
Keeping in mind that your loyal customer is only one click away from switching their loyalty to another brand, we also want to address the glaringly obvious elephant in the room: who among us can wait a “customer’s lifetime” to measure this stuff?
Near Term Value (NTV)
Some time ago I was introduced to Near Term Value (NTV) as an alternative to Customer LTV. With NTV, rather than relying on a customer-lifetime value, we instead look at the trailing 12 months from a customer’s entry date.
The enterprise I studied could accept a loss on an original order in hopes of making a profit soon thereafter. Understandably, they could not afford to continue spending marketing dollars over many years before finding out if that customer would be profitable. Gathering early, NTV results gave them trend metrics they could use to more confidently move forward.
How to Calculate NTV
Deriving NTV calculations from your M.O.M tables can be a bit challenging. Perhaps even more challenging than our earlier LTV reporting. But bear with me, as I outline the necessary steps:
- Grab 5 data fields
Note you can use the M.O.M. List Management module to export these fields or link to these M.O.M tables using MS Access:
– Entry year: parsed from the Cust table, EntryDate field
– Order date: from the CMS table, Odr_Date field
– Total $ Amount of order: from the CMS table, Ord_Total field
– Unit cost $: from the Items table, It_uncost field
– Quantity ordered: from the Items table, Quanto field - Create a relational database
Link the tables together via their primary keys (Customer number and Order number) - Build a new, calculated “Trail12mo$” field
“Trail12mo$” will be a currency field that is populated as follows: for each unique customer record,
– Calculation: Trail12mo$ = Sum of ((Ord_Total) – (It_Uncost x Quanto))
– Criteria: Odr_Date <= (EntryDate +365) - Create a NTV crosstab report
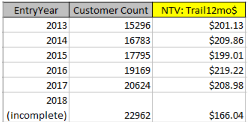
Entry Year rows versus Near Term Value columns – see example below. Crosstab reports can be easily done with MS Access or other tools. - Simplification
Technically speaking, NTV $ should be reduced by the average acquisition $ cost per customer (in the entry year). To simplify this analysis, we are ignoring that variable. Feel free to reduce the NTV calculation by that number, if you are savvy enough to know that number.
NTV CrossTab Report Example

Contrasting the differences between LTV and NTV illustrates their value in two ways.
- Instant feedback:
**NTV uses first 12 Months Net Revenue.
**LTV uses Lifetime Net Revenue.
Thus, NTV is a better representation of “what have you done for me lately?” For instance, if your organization has gone through recent product changes, NTV gives you early warnings of how your customer base is embracing the change. - Customer loyalty metrics: Unlike LTV, NTV should not decrease in value year over year. Thus, NTV becomes more valuable as a consistent measure of customer loyalty.
Rest easy – if your customer loyalty metrics are becoming worrisome, try the NTV approach. Comparing NTV year over year may help smooth out changes in buying patterns, product trends and your customer buying cycle.
Want more information on how you can make the most out of using NTV to gain insight into your customer base? Reach out to Freestyle today to learn more.
Bruce Gregoire is Founder and CEO of WiseGuys Marketing, based in Falls Church, VA. He is also a guest speaker on CRM in the graduate marketing department of the Carey Business School, Johns Hopkins University. Since 1998, Bruce has assisted more than 100 clients – many with the Freestyle platform – with their database marketing needs.
WiseGuys Marketing
(703) 941-8109
BruceGregoire@WiseGuysMarketing.com


